Chains
BNB Beacon Chain
BNB ecosystem’s staking & governance layer
Staking
Earn rewards by securing the network
Build
Explore
Accelerate
Connect
Designing Benchmarks for Trading-Focused Blockchains

Blockchain performance is often boiled down to a single metric—Transactions Per Second (TPS). But on BNB Chain, where trading and DeFi activity dominate, TPS alone doesn’t capture the reality.
That’s why benchmarks matter. They model real workloads—swaps, liquidity moves, NFT mints, and contract interactions—the things that actually define user experience.
At BNB Chain, our benchmarks are:
- Representative — modeled after real trading-heavy usage.
- Objective — published without bias or exaggerated claims.
- Transparent — verifiable by anyone through open scripts, configs, and machine specs.
In this blog, we will share:
- Why traditional TPS metrics fall short for trading-heavy blockchains.
- The difference between performance tests and benchmarks, and why both matter.
- How we design representative workloads that reflect real DeFi trading activity.
- Benchmarking principles and scenarios we use to evaluate performance fairly.
- Data design strategies for simulating millions of active users and realistic state growth.
- Evaluation criteria that define meaningful results—throughput, latency, and consistency.
- Execution methodology for repeatable, transparent benchmarking.
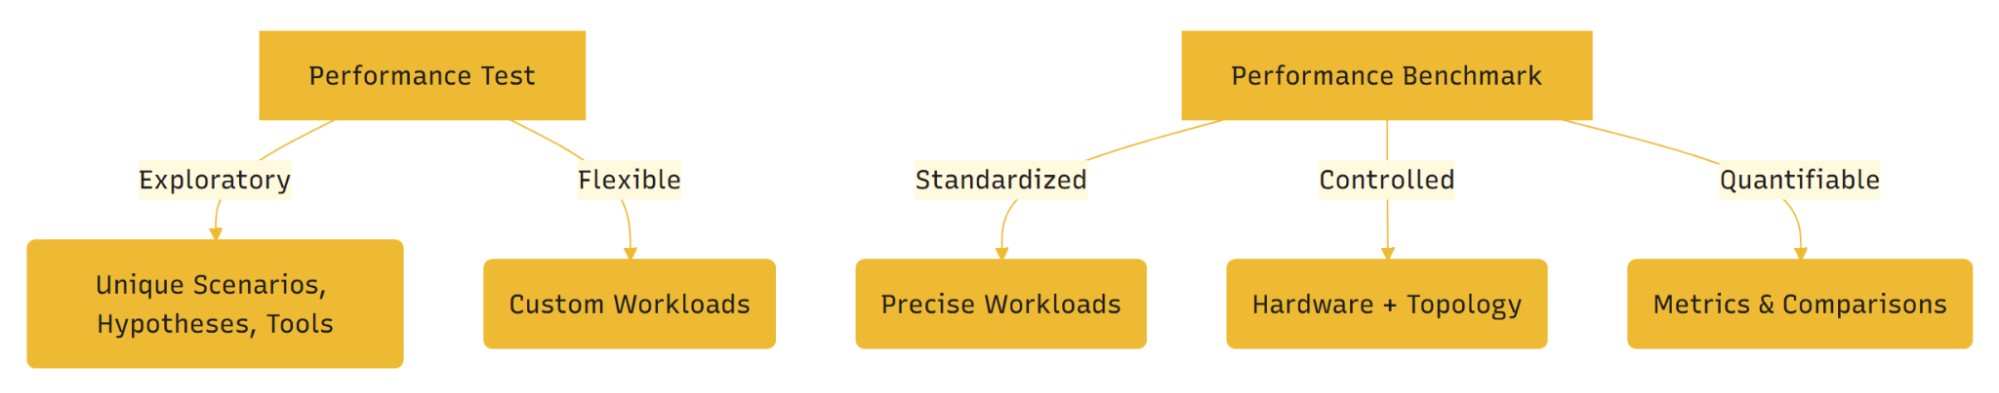
Performance Test vs. Performance Benchmark
It’s important to distinguish between tests and benchmarks:
- Performance tests are exploratory. Teams design unique scenarios to understand how the client behaves in a given context. Flexible, but not standardized.
- Performance benchmarks are prescriptive. They follow strict rules: defined workloads, controlled environments, and quantifiable, repeatable results.
Key difference: A performance test focuses on the product itself. A performance benchmark focuses on comparison across systems and time.
Benchmark Design: Principles and Scenarios
The purpose of BNB Chain benchmarking is to evaluate performance with close-to-real DeFi trading scenarios, rather than artificial or simplified loads.
Node Design
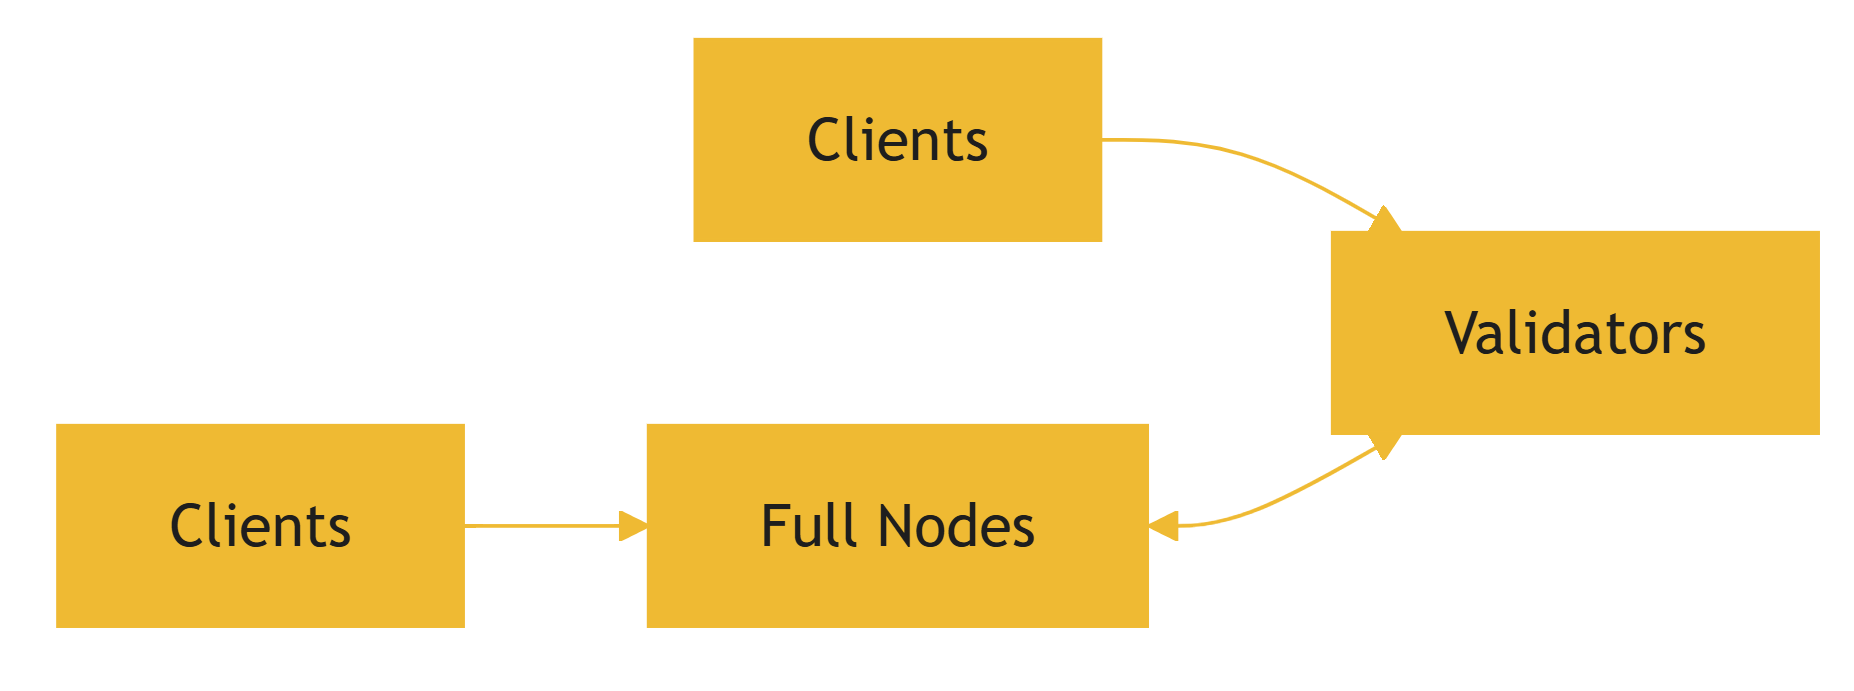
A: Clients → Validators (acceptable).B: Clients → Full Nodes ↔ Validators (recommended).
Why is B recommended? In production, validators rarely receive direct requests. Full nodes handle RPCs, bridging, and load distribution.
Scenarios Design
Why this matters: TPS is ambiguous unless it accounts for transaction complexity. AMM swaps are central to DeFi, so weighting them heavily ensures benchmarks reflect true blockchain usage.
Data Design
To make benchmarks realistic, we design large-scale data environments:
- Token Setup
- 16 BEP20 tokens.
- 24 trading pairs (8 BEP20↔BEP20, 16 BNB↔BEP20).
- User Allocation
- Active users receive native, wrapped, and BEP20 tokens.
- Distribution ensures every user can interact with trading pairs.
- User Groups
- Hot scenario: smaller group, each user submits multiple transactions.
- Cold scenario: larger group, each user submits one transaction.
- Transfer design:
- Distinct “to” addresses maximize parallelism.
- Limited “to” addresses simulate contention.
Core design concepts:
- Cold vs. hot access simulates first-time vs. repeat use.
- This ensures a mix of cold access (storage expansion) and hot access (congestion/conflict handling).
- Limited trading pairs + high concurrency = state conflicts (mirroring congestion in BSC’s early history).
Data Volume
We use different scales to capture both short- and long-term performance:
- Option A: 1M active users, 115k+ blocks.
- Option B (recommended): 25M active users, ~3M blocks.
Distribution: User activity is randomized across blocks. There’s no strict mapping of users → blocks. Instead, transaction load scripts distribute users/scenarios stochastically, ensuring storage growth comes from accounts, states, and blocks, not artificial alignment.
Larger tests expose how storage growth impacts performance over time. For continuous benchmarking, expanding test networks regularly is critical.
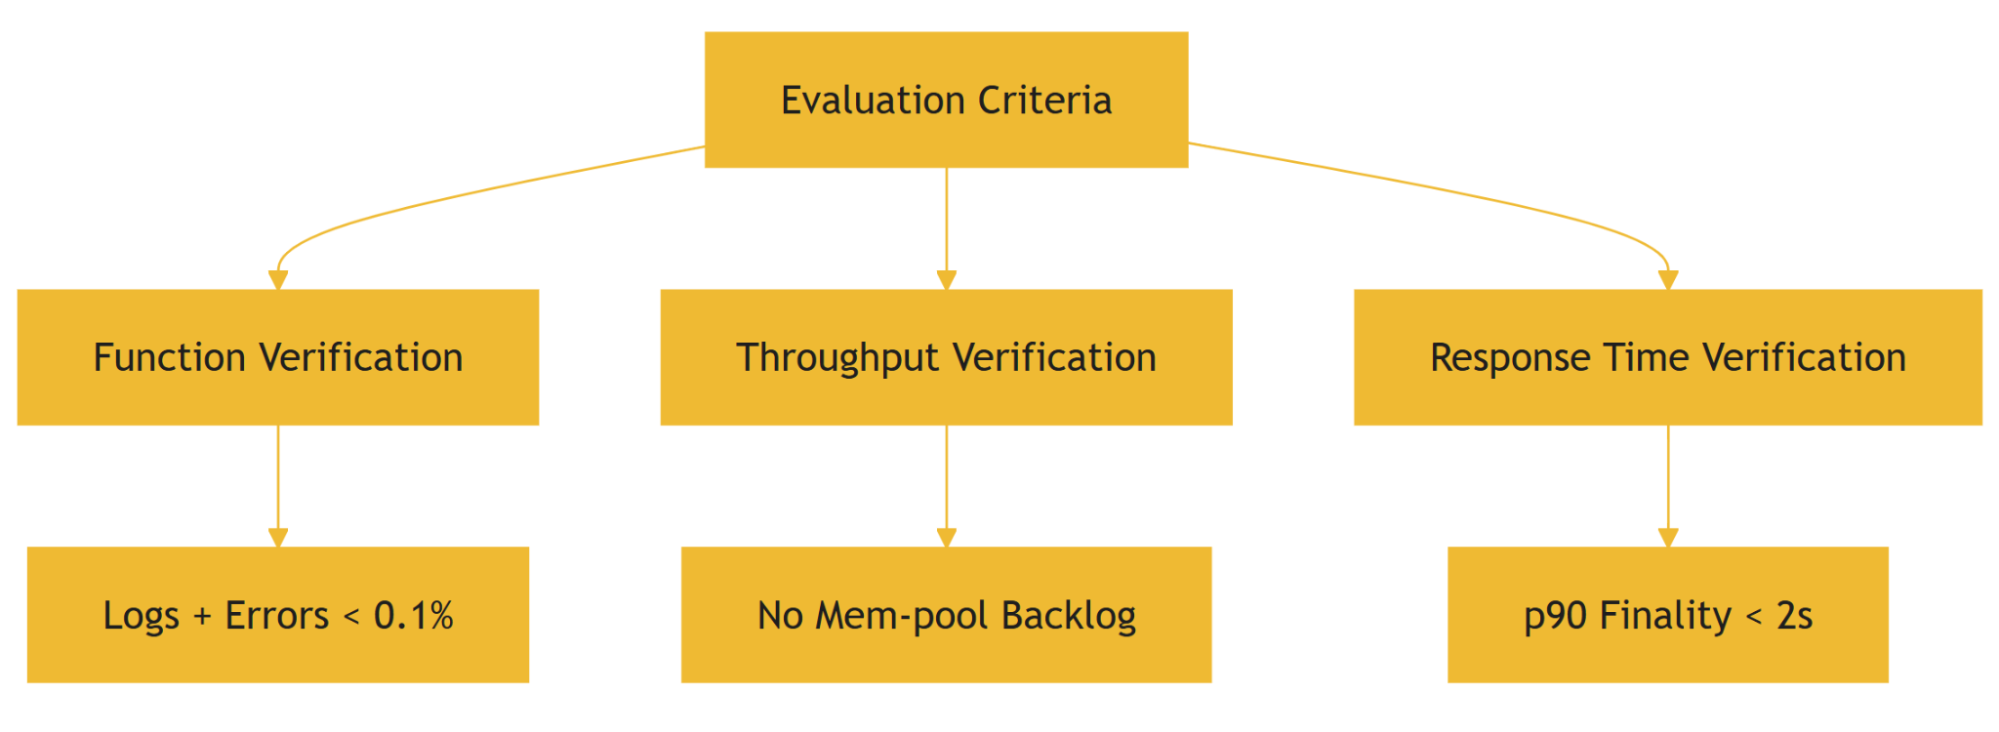
Evaluation Criteria
To ensure benchmarks are meaningful, we define strict verification checks:
1. Function Verification
- No validator or full node errors.
- Empty block rate < 0.1%.
- Failed transactions < 0.1%.
2. Throughput Verification
- Transactions per block match client submission rates.
- Validators’ mem-pools must not backlog after load.
3. Response Time Verification
Define block finality (e.g. 90th Percentile Block Finality < 2 seconds).
- Block Finality: the time it takes for a transaction to be considered irreversible (or in other words “final”) on the chain.
Percentile Metric: used to measure performance - p90 represents 90% of block must finalize within 2 seconds. The remaining 10% may take longer but should not degrade significantly.
Why Percentiles? Percentiles capture real-world consistency. Averages can hide spikes, but a p90 target ensures most transactions confirm quickly, keeping user experience smooth. Percentiles matter more than averages because they capture worst-case consistency.
How Tests Are Executed
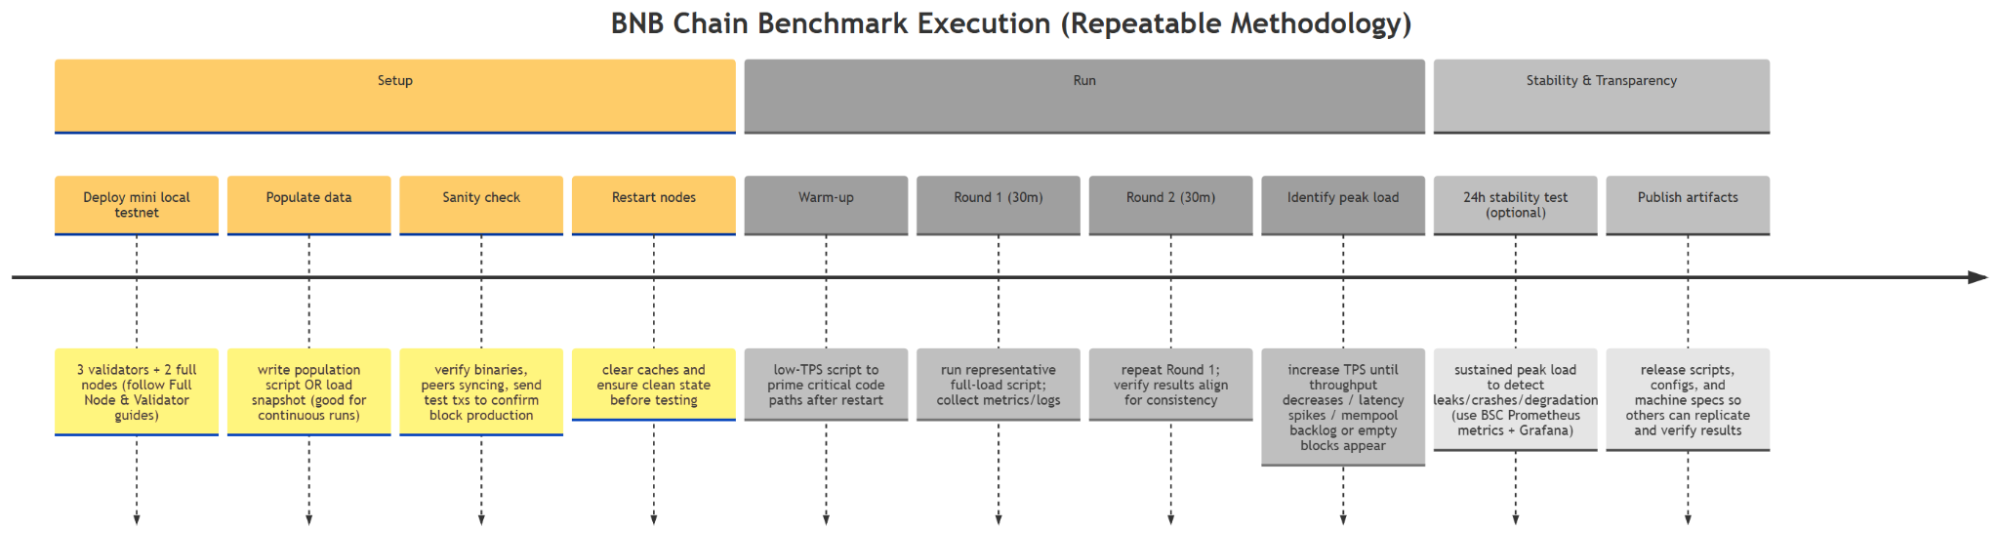
Our execution methodology ensures repeatability:
BNB Chain has not open-sourced its workload driver. Users must implement their own transaction scripts based on the design reference.
Conclusion: Confidence Through Transparency
For trading-focused blockchains, benchmarks aren’t vanity metrics — they’re about confidence.
By modeling realistic workloads, running them at scale, and publishing results transparently, BNB Chain demonstrates both performance today and readiness for tomorrow.
This is our commitment: infrastructure that developers, traders, and node operators can trust to keep pace with the demands of a trading-heavy ecosystem.